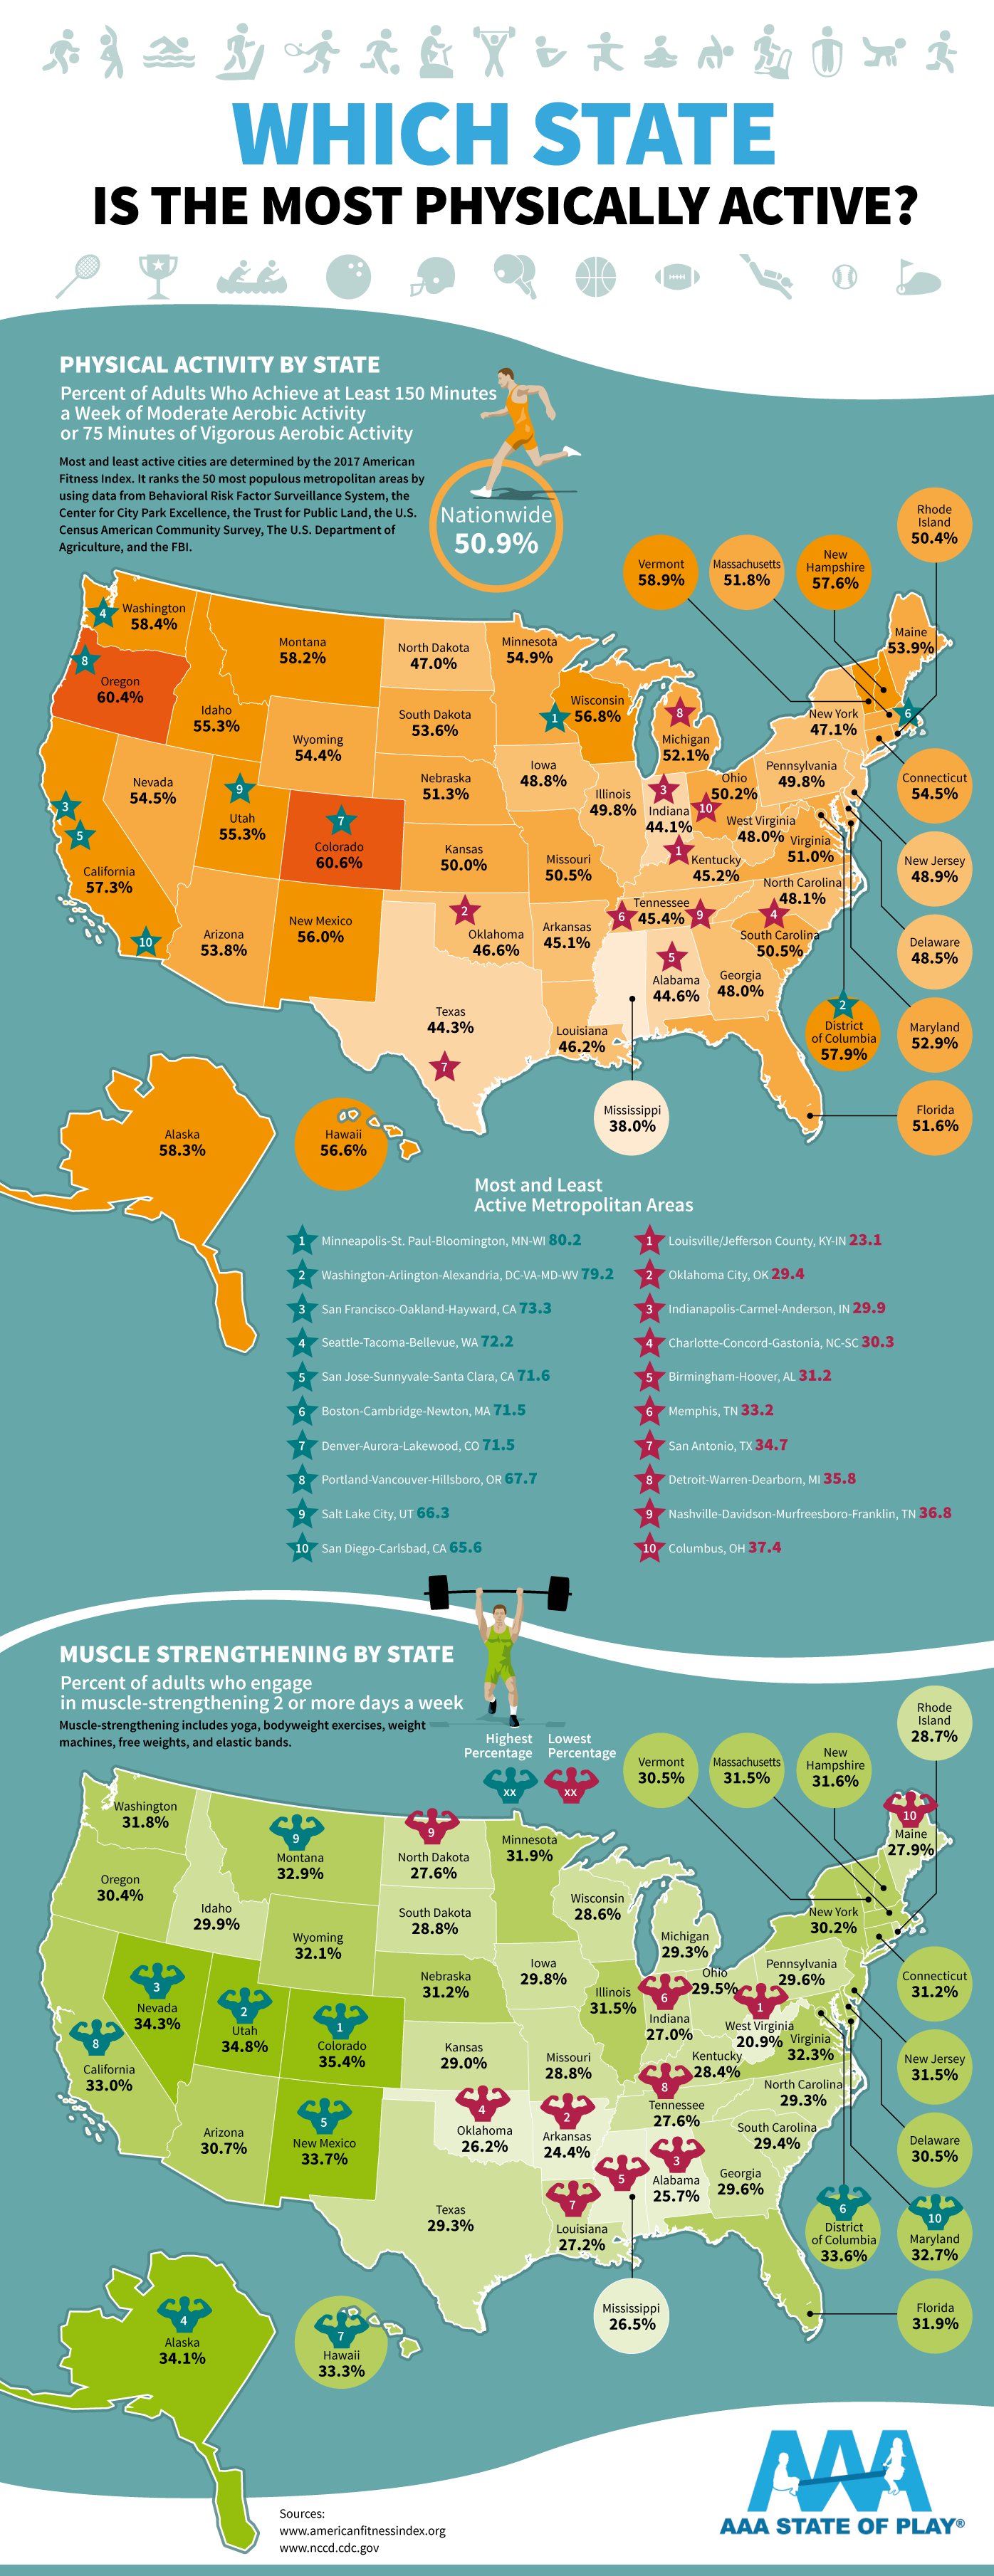
Statistical data, though a mass of numbers and percentages, often throws up thought-provoking insights about human behavior, and acts as a mirror for cultural mores. Analysis of physical activity habits across USA paints very interesting pictures: for example, while the nationwide average for physical activity is 50.9%, Minneapolis residents really buck the average at 80.2%, while Louisianans, at 23.1% obviously hate to exercise!
Here’s a graphic representation of the 50 states’ proclivity for moderate to vigorous aerobic or muscle-strengthening exercises, based on the American Fitness Index 2017, and other sources.
Infographic by – AAA State of Play